Grafana - All-in-one
In this example, we are going to use Prometheus and Jaeger, both displayed inside Grafana. Just like Jaeger example, we will need to set up an Open Telemetry Collector to gather both metrics and traces.
Project setup
Configure the project using your favorite tool, once again setup is similar to the Jaeger example, only difference being that we export metrics as they will be stored inside Prometheus:
Add settings to the build.sbt:
libraryDependencies ++= Seq(
  "org.typelevel" %% "otel4s-oteljava" % "0.13.0", // <1>
  "io.opentelemetry" % "opentelemetry-exporter-otlp" % "1.51.0" % Runtime, // <2>
  "io.opentelemetry" % "opentelemetry-sdk-extension-autoconfigure" % "1.51.0" % Runtime // <3>
)
run / fork := true
javaOptions += "-Dotel.java.global-autoconfigure.enabled=true"       // <4>
javaOptions += "-Dotel.service.name=grafana-example"                 // <5>
javaOptions += "-Dotel.exporter.otlp.endpoint=http://localhost:4317" // <6>
Add directives to the grafana.scala:
//> using scala 3.3.0
//> using dep "org.typelevel::otel4s-oteljava:0.13.0" // <1>
//> using dep "io.opentelemetry:opentelemetry-exporter-otlp:1.51.0" // <2>
//> using dep "io.opentelemetry:opentelemetry-sdk-extension-autoconfigure:1.51.0" // <3>
//> using javaOpt "-Dotel.java.global-autoconfigure.enabled=true"       // <4>
//> using javaOpt "-Dotel.service.name=grafana-example"                 // <5>
//> using javaOpt "-Dotel.exporter.otlp.endpoint=http://localhost:4317" // <6>
1) Add the otel4s library
2) Add an OpenTelemetry exporter. Without the exporter, the application will crash
3) Add an OpenTelemetry autoconfigure extension
4) Enable OpenTelemetry SDK autoconfigure mode
5) Add the name of the application to use in the traces
6) Add the OpenTelemetry Collector endpoint
OpenTelemetry SDK configuration
As mentioned above, we use otel.service.name and otel.metrics.exporter system properties to configure the
OpenTelemetry SDK.
The SDK can be configured via environment variables too. Check the full list
of environment variable configurations
for more options.
Observability stack configuration
Use the following docker-compose.yaml file:
version: '3.7'
services:
  otel-lgtm:
    image: grafana/otel-lgtm
    ports:
      - "3000:3000"
      - "4317:4317"
      - "4318:4318"
    networks:
      - static-network

networks:
static-network:Application example
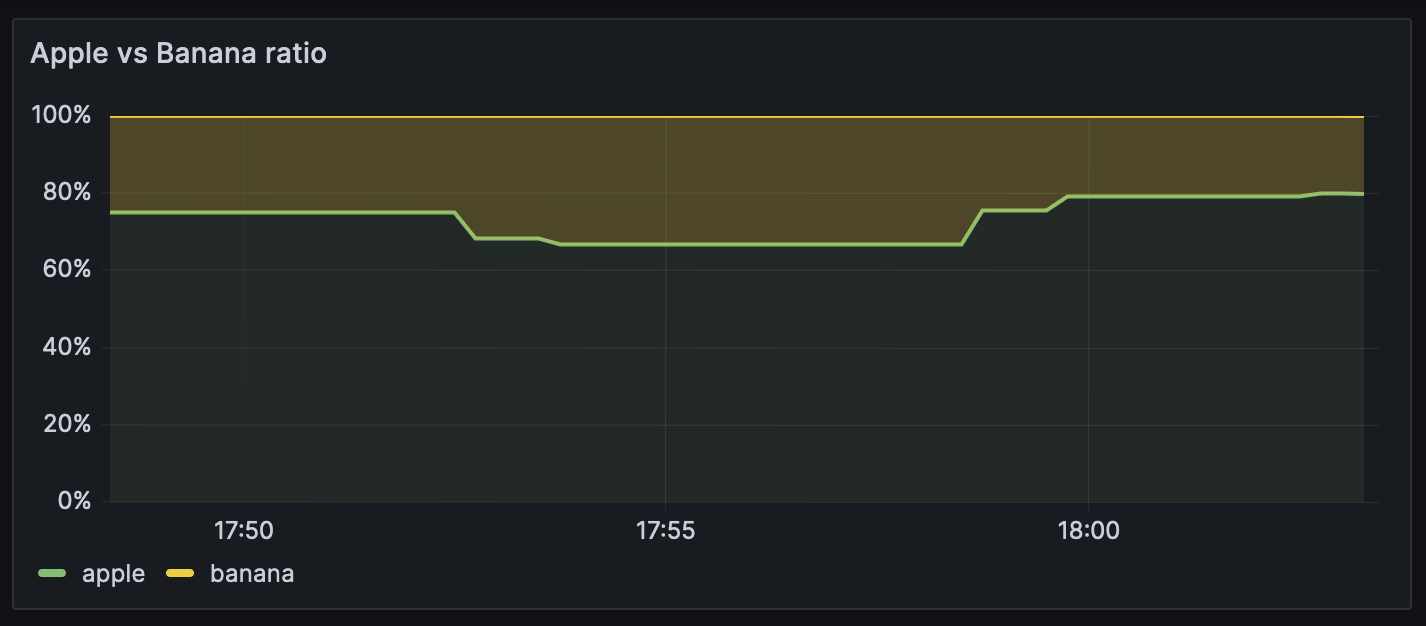
Example service mocking a call to a remote API: here the remote API returns apples or bananas. We're using the metrics to measure the apple/banana ratio returned by the API, and the traces to measure the latency of this API.
import cats.effect.{Async, IO, IOApp}
import cats.effect.std.Random
import cats.syntax.apply._
import cats.syntax.flatMap._
import cats.syntax.functor._
import org.typelevel.otel4s.Attribute
import org.typelevel.otel4s.oteljava.OtelJava
import org.typelevel.otel4s.metrics.Meter
import org.typelevel.otel4s.trace.Tracer

import java.util.concurrent.TimeUnit
import scala.concurrent.duration.FiniteDuration

case class ApiData(result: String)

trait ApiService[F[_]] {
  def getDataFromSomeAPI: F[ApiData]
}

object ApiService {
  def apply[F[_]: Async: Tracer: Meter: Random](
      minLatency: Int,
      maxLatency: Int,
      bananaPercentage: Int
  ): F[ApiService[F]] =
    Meter[F]
      .counter[Long]("RemoteApi.fruit.count")
      .withDescription("Number of fruits returned by the API.")
      .create
      .map { remoteApiFruitCount =>
        new ApiService[F] {
          override def getDataFromSomeAPI: F[ApiData] = for {
            latency <- Random[F].betweenInt(minLatency, maxLatency)
            isBanana <- Random[F].betweenInt(0, 100).map(_ <= bananaPercentage)
            duration = FiniteDuration(latency, TimeUnit.MILLISECONDS)
            fruit <- Tracer[F].span("remoteAPI.com/fruit").surround(
              Async[F].sleep(duration) *>
                Async[F].pure(if (isBanana) "banana" else "apple")
            )
            _ <- remoteApiFruitCount.inc(Attribute("fruit", fruit))
          } yield ApiData(s"Api returned a $fruit !")
        }
      }
}

object ExampleService extends IOApp.Simple {
  def run: IO[Unit] =
    OtelJava.autoConfigured[IO]()
      .evalMap { otel4s =>
        (
          otel4s.tracerProvider.get("com.service.runtime"),
          otel4s.meterProvider.get("com.service.runtime"),
          Random.scalaUtilRandom[IO]
        ).flatMapN { case components =>
          implicit val (tracer: Tracer[IO], meter: Meter[IO], random: Random[IO]) =
            components

          for {
            service <- ApiService[IO](
              minLatency = 40,
              maxLatency = 80,
              bananaPercentage = 70
            )
            data <- service.getDataFromSomeAPI
            _ <- IO.println(s"Service data: $data")
          } yield ()
        }
      }
      .use_
}Run the application
Setup your metrics dashboard
Connect to grafana and Add your Jaeger and Grafana data sources. Once done, you can create your first dashboard.
Now after making a few calls to ApiService.getDataFromSomeAPI, you should get some data points:
Adding your traces
Just like you just did with Prometheus, you can use Jaeger as data source and display traces using the appropriate data visualization in your new dashboard:
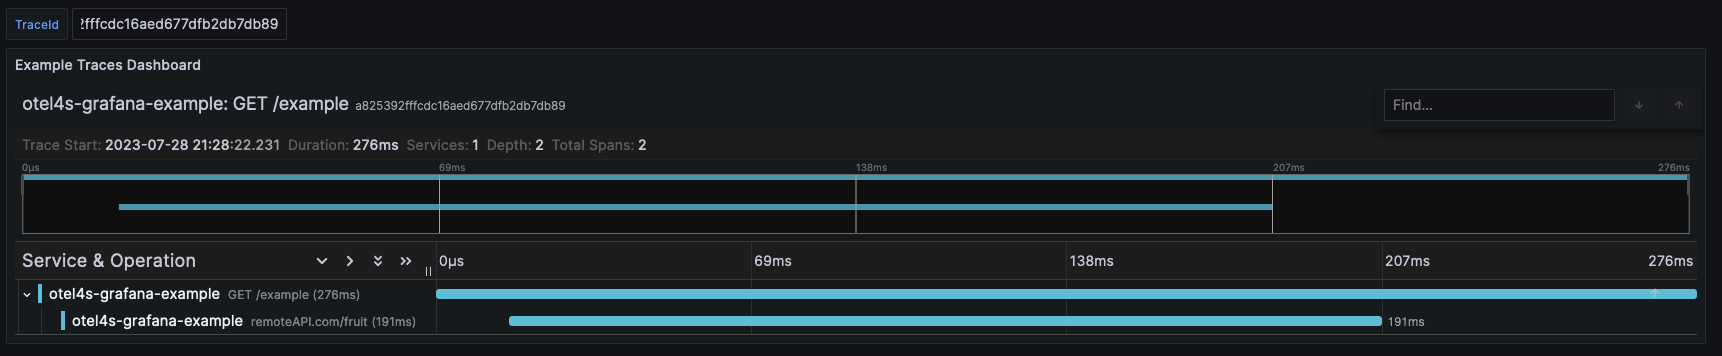
Note: a complete example is available here