Honeycomb - metrics and traces
In this example, we are going to use Honeycomb to collect and visualize metrics and traces produced by an application. We will cover the configuration of OpenTelemetry exporter, as well as the instrumentation of the application using the otel4s library.
Unlike Jaeger example, you do not need to set up a collector service locally. The metrics and traces will be sent to a remote Honeycomb API.
At the time of writing, Honeycomb allows having up to 20 million spans per month for a free account. It offers robust analysis and visualization tools that are handy for exploring the world of telemetry.
Project setup
Configure the project using your favorite tool:
Add settings to the build.sbt:
libraryDependencies ++= Seq(
  "org.typelevel" %% "otel4s-java" % "0.3-9dec203-SNAPSHOT", // <1>
  "io.opentelemetry" % "opentelemetry-exporter-otlp" % "1.28.0" % Runtime, // <2>
  "io.opentelemetry" % "opentelemetry-sdk-extension-autoconfigure" % "1.28.0" % Runtime // <3>
)
run / fork := true
javaOptions += "-Dotel.java.global-autoconfigure.enabled=true"            // <4>
javaOptions += "-Dotel.service.name=honeycomb-example"                    // <5>
javaOptions += "-Dotel.exporter.otlp.endpoint=https://api.honeycomb.io/"  // <6>
Add directives to the tracing.scala:
//> using lib "org.typelevel::otel4s-java:0.3-9dec203-SNAPSHOT" // <1>
//> using lib "io.opentelemetry:opentelemetry-exporter-otlp:1.28.0" // <2>
//> using lib "io.opentelemetry:opentelemetry-sdk-extension-autoconfigure:1.28.0" // <3>
//> using `java-opt` "-Dotel.java.global-autoconfigure.enabled=true"            // <4>
//> using `java-opt` "-Dotel.service.name=honeycomb-example"                    // <5>
//> using `java-opt` "-Dotel.exporter.otlp.endpoint=https://api.honeycomb.io/"  // <6>
1) Add the otel4s library
2) Add an OpenTelemetry exporter. Without the exporter, the application will crash
3) Add an OpenTelemetry autoconfigure extension
4) Enable OpenTelemetry SDK autoconfigure mode
5) Add the name of the application to use in the traces
6) Add the Honeycomb API endpoint
OpenTelemetry SDK configuration
As mentioned above, we use otel.java.global-autoconfigure.enabled and otel.service.name system properties to configure the
OpenTelemetry SDK.
The SDK can be configured via environment variables too. Check the full list
of environment variable configurations
for more options.
Acquiring a Honeycomb API key
The Honeycomb official guide.
First, you must create an account on the Honeycomb website. Once you have done this, log into your account and navigate to the environment settings page. There you can find a generated API key.
Honeycomb configuration
The Honeycomb official configuration guide.
In order to send metrics and traces to Honeycomb, the API key and dataset name need to be configured. Since the API key is sensitive data, we advise providing them via environment variables:
$ export OTEL_EXPORTER_OTLP_HEADERS="x-honeycomb-team=your-api-key,x-honeycomb-dataset=honeycomb-example"1) x-honeycomb-team - the API key
2) x-honeycomb-dataset - the name of the dataset to send metrics to. We use honeycomb-example so both metrics and traces appear in the same dataset.
Note: if the x-honeycomb-dataset header is not configured, the metrics will be sent to a dataset called unknown_metrics.
Application example
import java.util.concurrent.TimeUnit

import cats.effect.{Async, IO, IOApp}
import cats.effect.std.Console
import cats.effect.std.Random
import cats.syntax.all._
import org.typelevel.otel4s.{Attribute, AttributeKey}
import org.typelevel.otel4s.java.OtelJava
import org.typelevel.otel4s.metrics.Histogram
import org.typelevel.otel4s.trace.Tracer

import scala.concurrent.duration._

trait Work[F[_]] {
  def doWork: F[Unit]
}

object Work {
  def apply[F[_] : Async : Tracer : Console](histogram: Histogram[F, Double]): Work[F] =
    new Work[F] {
      def doWork: F[Unit] =
        Tracer[F].span("Work.DoWork").use { span =>
          span.addEvent("Starting the work.") *>
            doWorkInternal(steps = 10) *>
            span.addEvent("Finished working.")
        }

      def doWorkInternal(steps: Int): F[Unit] = {
        val step = Tracer[F]
          .span("internal", Attribute(AttributeKey.long("steps"), steps.toLong))
          .surround {
            for {
              random <- Random.scalaUtilRandom
              delay <- random.nextIntBounded(1000)
              _ <- Async[F].sleep(delay.millis)
              _ <- Console[F].println("Doin' work")
            } yield ()
          }

        val metered = histogram.recordDuration(TimeUnit.MILLISECONDS).surround(step)

        if (steps > 0) metered *> doWorkInternal(steps - 1) else metered
      }
    }
}

object TracingExample extends IOApp.Simple {
  def run: IO[Unit] = {
    OtelJava.global.flatMap { otel4s =>
      otel4s.tracerProvider.get("com.service.runtime")
        .flatMap { implicit tracer: Tracer[IO] =>
          for {
            meter <- otel4s.meterProvider.get("com.service.runtime")
            histogram <- meter.histogram("work.execution.duration").create
            _ <- Work[IO](histogram).doWork
          } yield ()
        }
    }
  }
}
Run the application
$ export OTEL_EXPORTER_OTLP_HEADERS="x-honeycomb-team=your-api-key,x-honeycomb-dataset=honeycomb-example"
$ sbt run
$ export OTEL_EXPORTER_OTLP_HEADERS="x-honeycomb-team=your-api-key,x-honeycomb-dataset=honeycomb-example"
$ scala-cli run tracing.scalaQuery collected traces and metrics
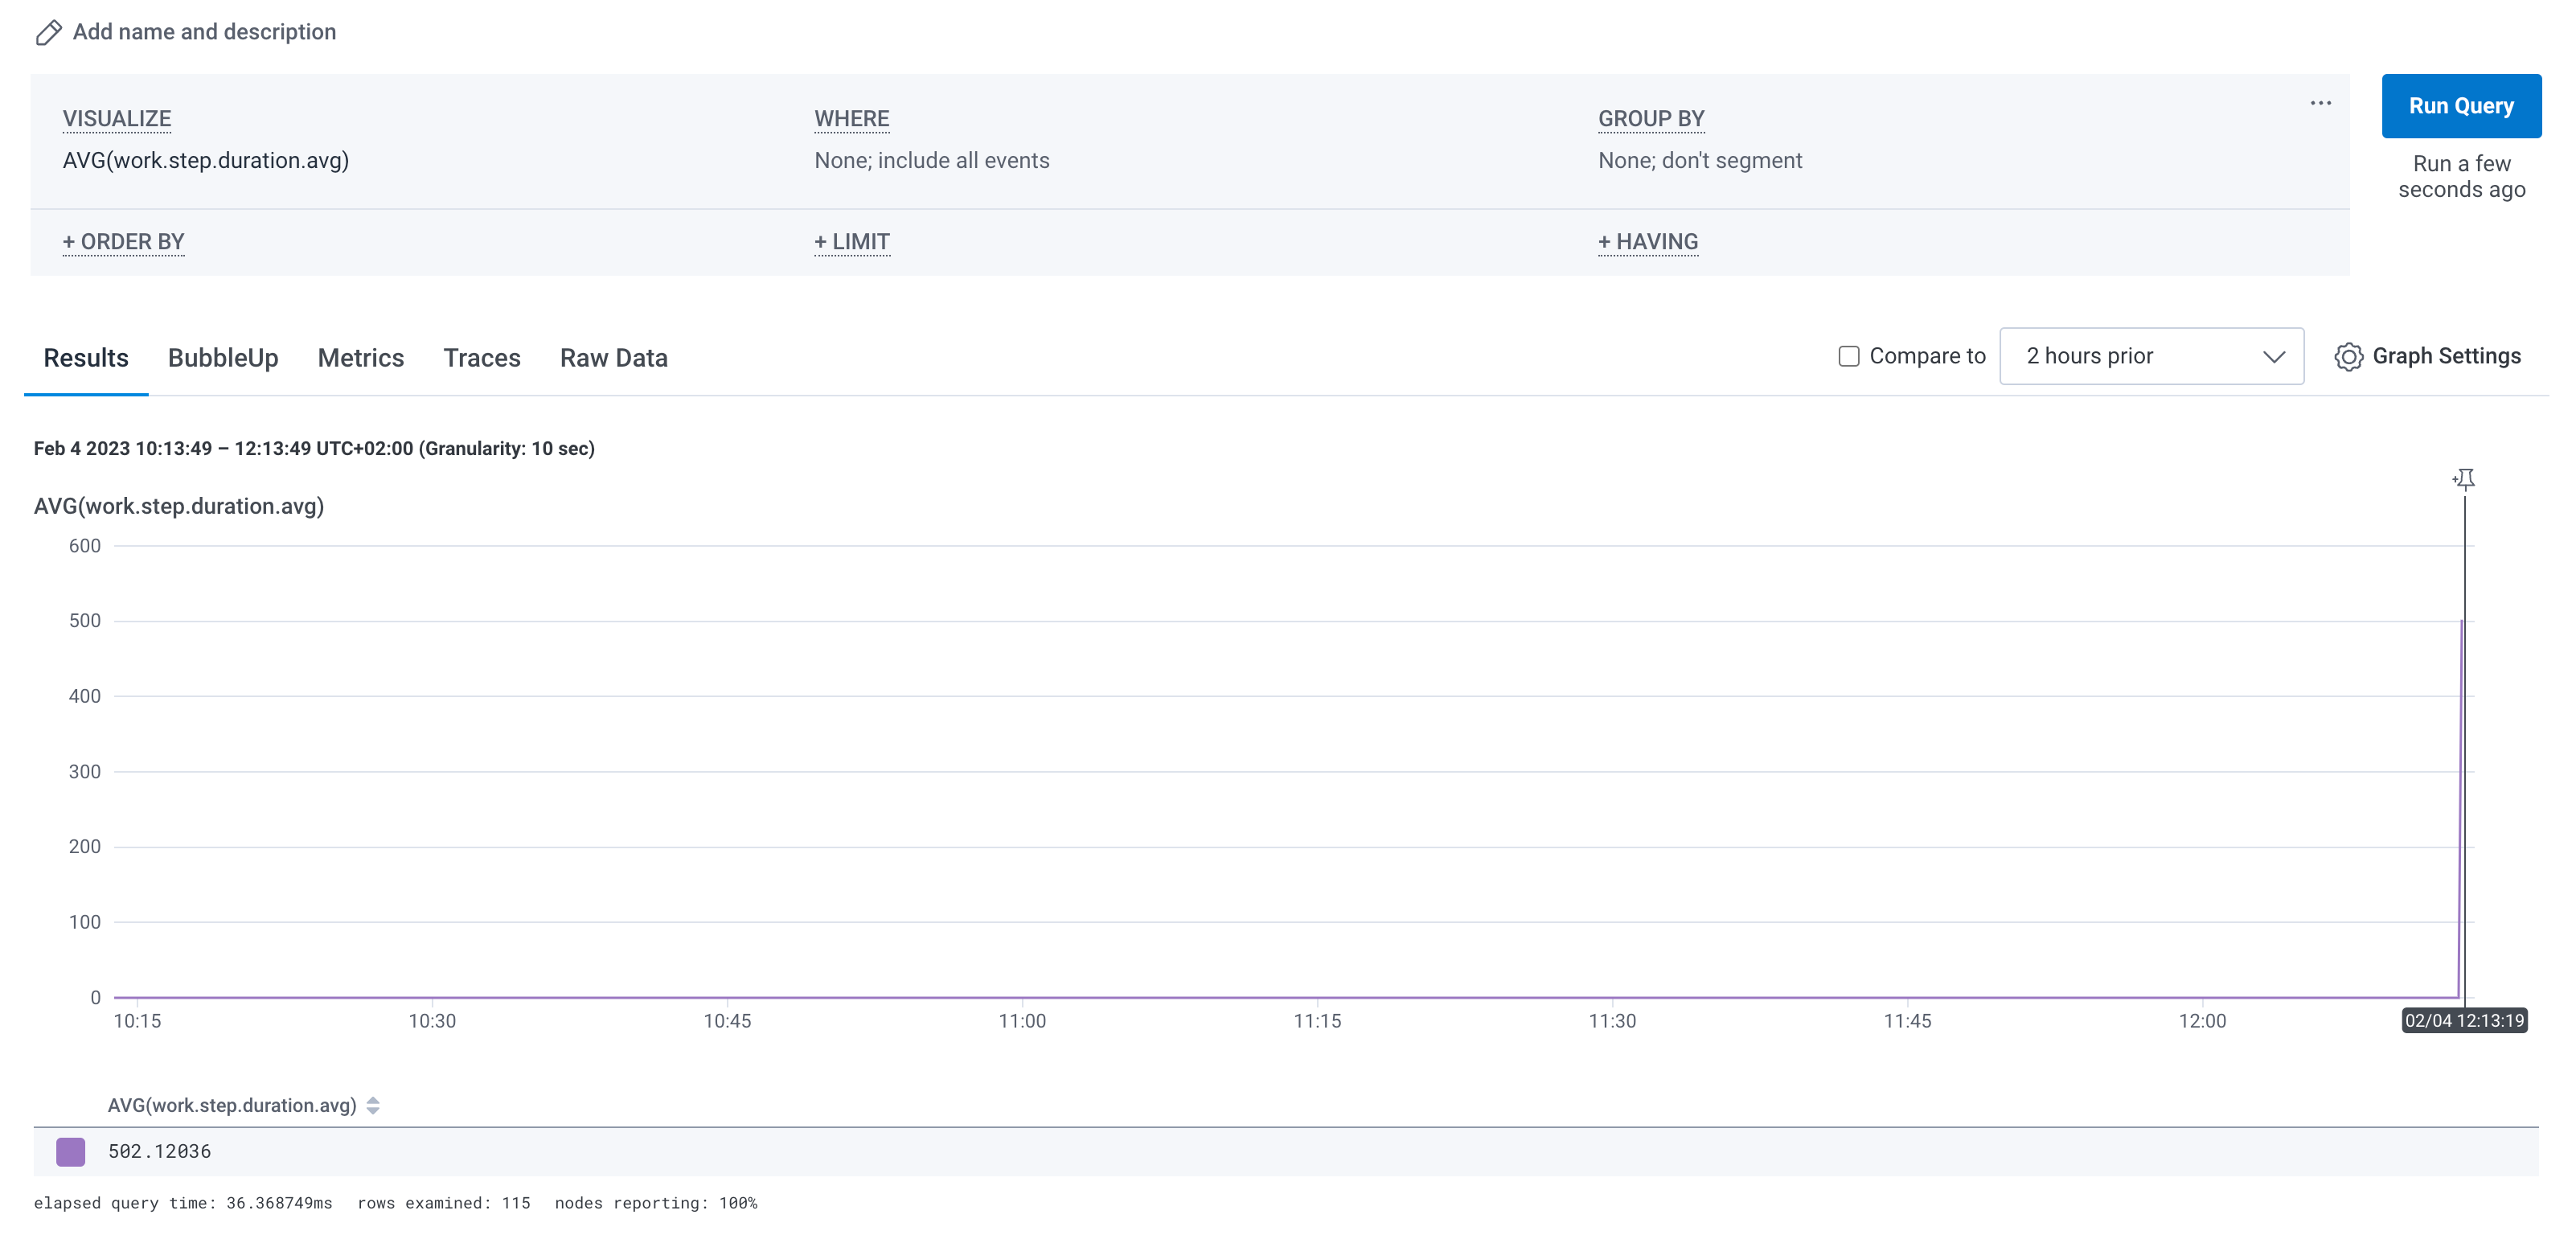
You can query collected traces and metrics at https://ui.honeycomb.io/.
Traces
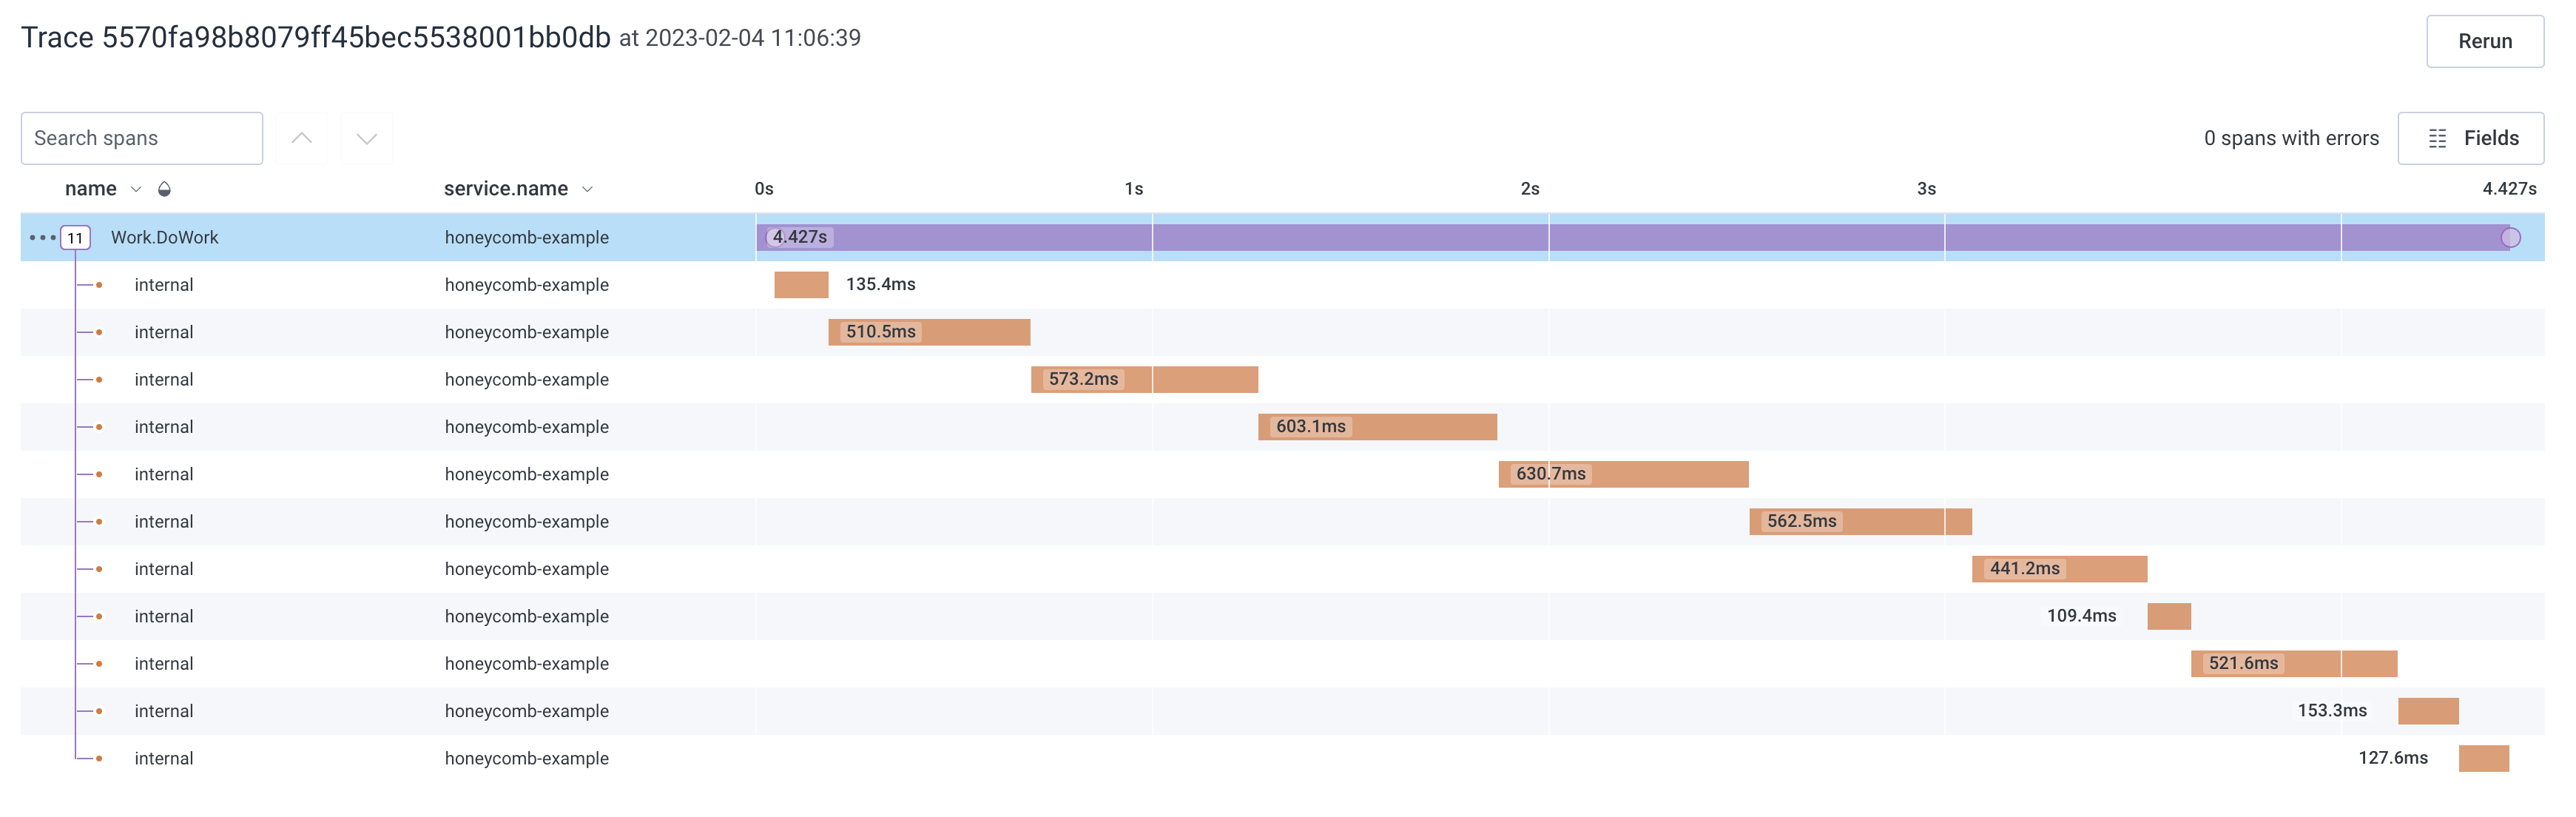
Metrics