Jaeger - collecting traces
In this example, we are going to use Jaeger to collect and visualize traces produced by an application. We will cover the installation and configuration of Jaeger, as well as the instrumentation of the application using the otel4s library.
Project setup
Configure the project using your favorite tool:
Add settings to the build.sbt:
libraryDependencies ++= Seq(
  "org.typelevel" %% "otel4s-java" % "0.3-9dec203-SNAPSHOT", // <1>
  "io.opentelemetry" % "opentelemetry-exporter-otlp" % "1.28.0" % Runtime, // <2>
  "io.opentelemetry" % "opentelemetry-sdk-extension-autoconfigure" % "1.28.0" % Runtime // <3>
)
run / fork := true
javaOptions += "-Dotel.java.global-autoconfigure.enabled=true" // <4>
javaOptions += "-Dotel.service.name=jaeger-example"            // <5>
javaOptions += "-Dotel.metrics.exporter=none"                  // <6>
Add directives to the tracing.scala:
//> using lib "org.typelevel::otel4s-java:0.3-9dec203-SNAPSHOT" // <1>
//> using lib "io.opentelemetry:opentelemetry-exporter-otlp:1.28.0" // <2>
//> using lib "io.opentelemetry:opentelemetry-sdk-extension-autoconfigure:1.28.0" // <3>
//> using `java-opt` "-Dotel.java.global-autoconfigure.enabled=true" // <4>
//> using `java-opt` "-Dotel.service.name=jaeger-example"            // <5>
//> using `java-opt` "-Dotel.metrics.exporter=none"                  // <6>
1) Add the otel4s library
2) Add an OpenTelemetry exporter. Without the exporter, the application will crash
3) Add an OpenTelemetry autoconfigure extension
4) Enable OpenTelemetry SDK autoconfigure mode
5) Add the name of the application to use in the traces
6) Disable metrics exporter since Jaeger is compatible only with traces
OpenTelemetry SDK configuration
As mentioned above, we use otel.service.name and otel.metrics.exporter system properties to configure the
OpenTelemetry SDK.
The SDK can be configured via environment variables too. Check the full list
of environment variable configurations
for more options.
Jaeger configuration
In order to collect and visualize traces, you can run Jaeger using Docker.
$ docker run --name jaeger \
  -e COLLECTOR_OTLP_ENABLED=true \
  -p 16686:16686 \
  -p 4317:4317 \
  -p 4318:4318 \
  jaegertracing/all-in-one:1.35
1) -e COLLECTOR_OTLP_ENABLED=true - enable OpenTelemetry receiver
2) -p 16686:16686 - forward Jaeger UI
3) -p 4317:4317 and -p 4318:4318 - the OpenTelemetry receiver ports for HTTP and gRPC protocols
Application example
import cats.effect.{Async, IO, IOApp}
import cats.effect.std.Console
import cats.effect.std.Random
import cats.syntax.all._
import org.typelevel.otel4s.Attribute
import org.typelevel.otel4s.java.OtelJava
import org.typelevel.otel4s.trace.Tracer

import scala.concurrent.duration._

trait Work[F[_]] {
  def doWork: F[Unit]
}

object Work {
  def apply[F[_] : Async : Tracer : Console]: Work[F] =
    new Work[F] {
      def doWork: F[Unit] =
        Tracer[F].span("Work.DoWork").use { span =>
          span.addEvent("Starting the work.") *>
            doWorkInternal(steps = 10) *>
            span.addEvent("Finished working.")
        }

      def doWorkInternal(steps: Int): F[Unit] = {
        val step = Tracer[F]
          .span("internal", Attribute("steps", steps.toLong))
          .surround {
            for {
              random <- Random.scalaUtilRandom
              delay <- random.nextIntBounded(1000)
              _ <- Async[F].sleep(delay.millis)
              _ <- Console[F].println("Doin' work")
            } yield ()
          }

        if (steps > 0) step *> doWorkInternal(steps - 1) else step
      }
    }
}

object TracingExample extends IOApp.Simple {
  def tracer: IO[Tracer[IO]] =
    OtelJava.global.flatMap(_.tracerProvider.get("Example"))

  def run: IO[Unit] = {
    tracer.flatMap { implicit tracer: Tracer[IO] =>
      Work[IO].doWork
    }
  }
}
Run the application
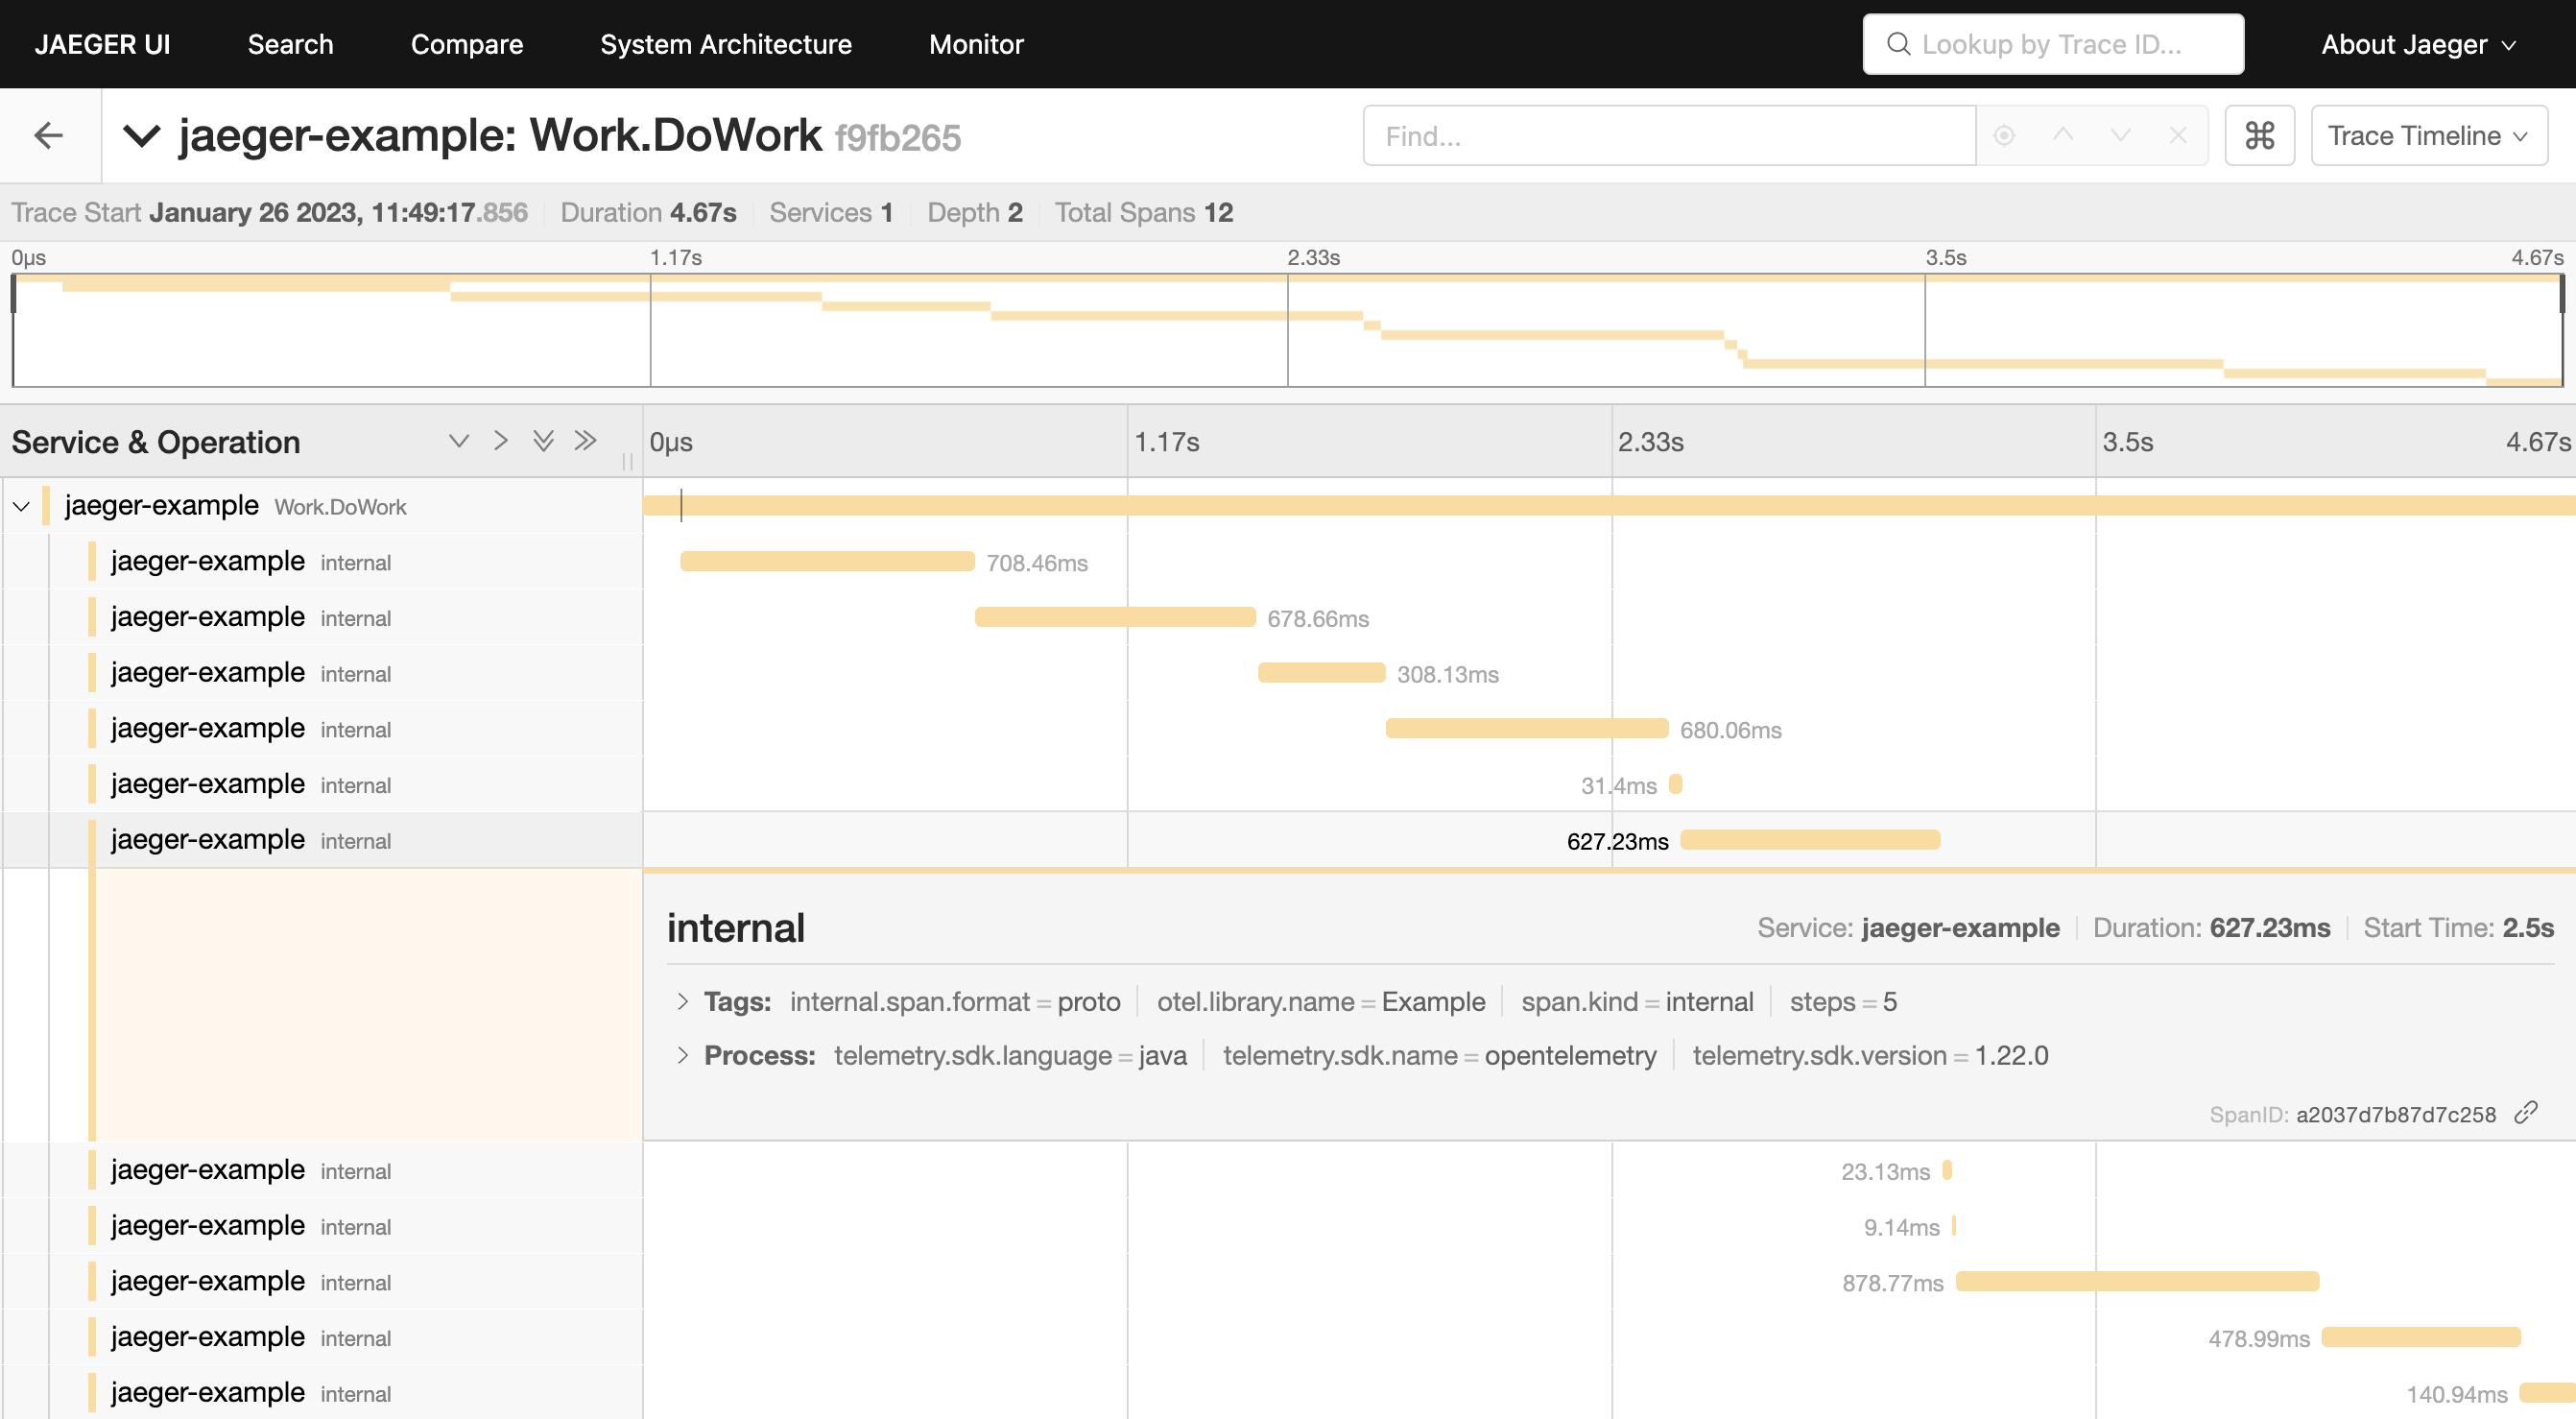
Review collected traces
Jaeger UI is available at http://localhost:16686. You can find the collected traces there.