
Register Cats Effect runtime metrics
Use this page when you want to export runtime metrics such as CPU starvation and work-stealing thread pool activity from a Cats Effect application.
Prerequisites
1. Add the dependency
Add settings to build.sbt:
libraryDependencies ++= Seq(
  "org.typelevel" %%% "otel4s-instrumentation-metrics" % "1.1.0" // <1>
)
Add directives to the *.scala file:
//> using dep "org.typelevel::otel4s-instrumentation-metrics::1.1.0" // <1>- Add
otel4s-instrumentation-metrics
2. Register the collectors at application startup
Register the collectors after you create OtelJava and keep them active while your application runs.
import cats.effect.{IO, IOApp}
import org.typelevel.otel4s.instrumentation.ce.IORuntimeMetrics
import org.typelevel.otel4s.metrics.MeterProvider
import org.typelevel.otel4s.oteljava.OtelJava

object Main extends IOApp.Simple {
  def run: IO[Unit] =
    OtelJava.autoConfigured[IO]().use { otel4s =>
      implicit val meterProvider: MeterProvider[IO] = otel4s.meterProvider

      IORuntimeMetrics
        .register[IO](runtime.metrics, IORuntimeMetrics.Config.default)
        .surround(program)
    }

  def program: IO[Unit] =
    IO.never
}3. Keep the registration scope open while metrics should be collected
IORuntimeMetrics.register returns a Resource.
That resource owns the runtime collectors. In practice, this means:
- use
.surround(...)when the collectors should stay active for the whole program - or keep the
Resourceopen around the part of the application that should emit runtime metrics
4. Customize the config only when you need to
Start with IORuntimeMetrics.Config.default. Change it when you need to disable parts of the metric set or add
attributes.
For example, to disable CPU starvation metrics:
import org.typelevel.otel4s.instrumentation.ce.IORuntimeMetrics.Config._
import org.typelevel.otel4s.metrics.MeterProvider

val runtime = cats.effect.unsafe.implicits.global

val config: IORuntimeMetrics.Config =
  IORuntimeMetrics.Config(
    CpuStarvationConfig.disabled,
    WorkStealingThreadPoolConfig.enabled
  )

def register(implicit meterProvider: MeterProvider[IO]) =
  IORuntimeMetrics.register[IO](runtime.metrics, config)
For the complete metric catalog and configuration surface, see the Cats Effect IO runtime metrics reference.
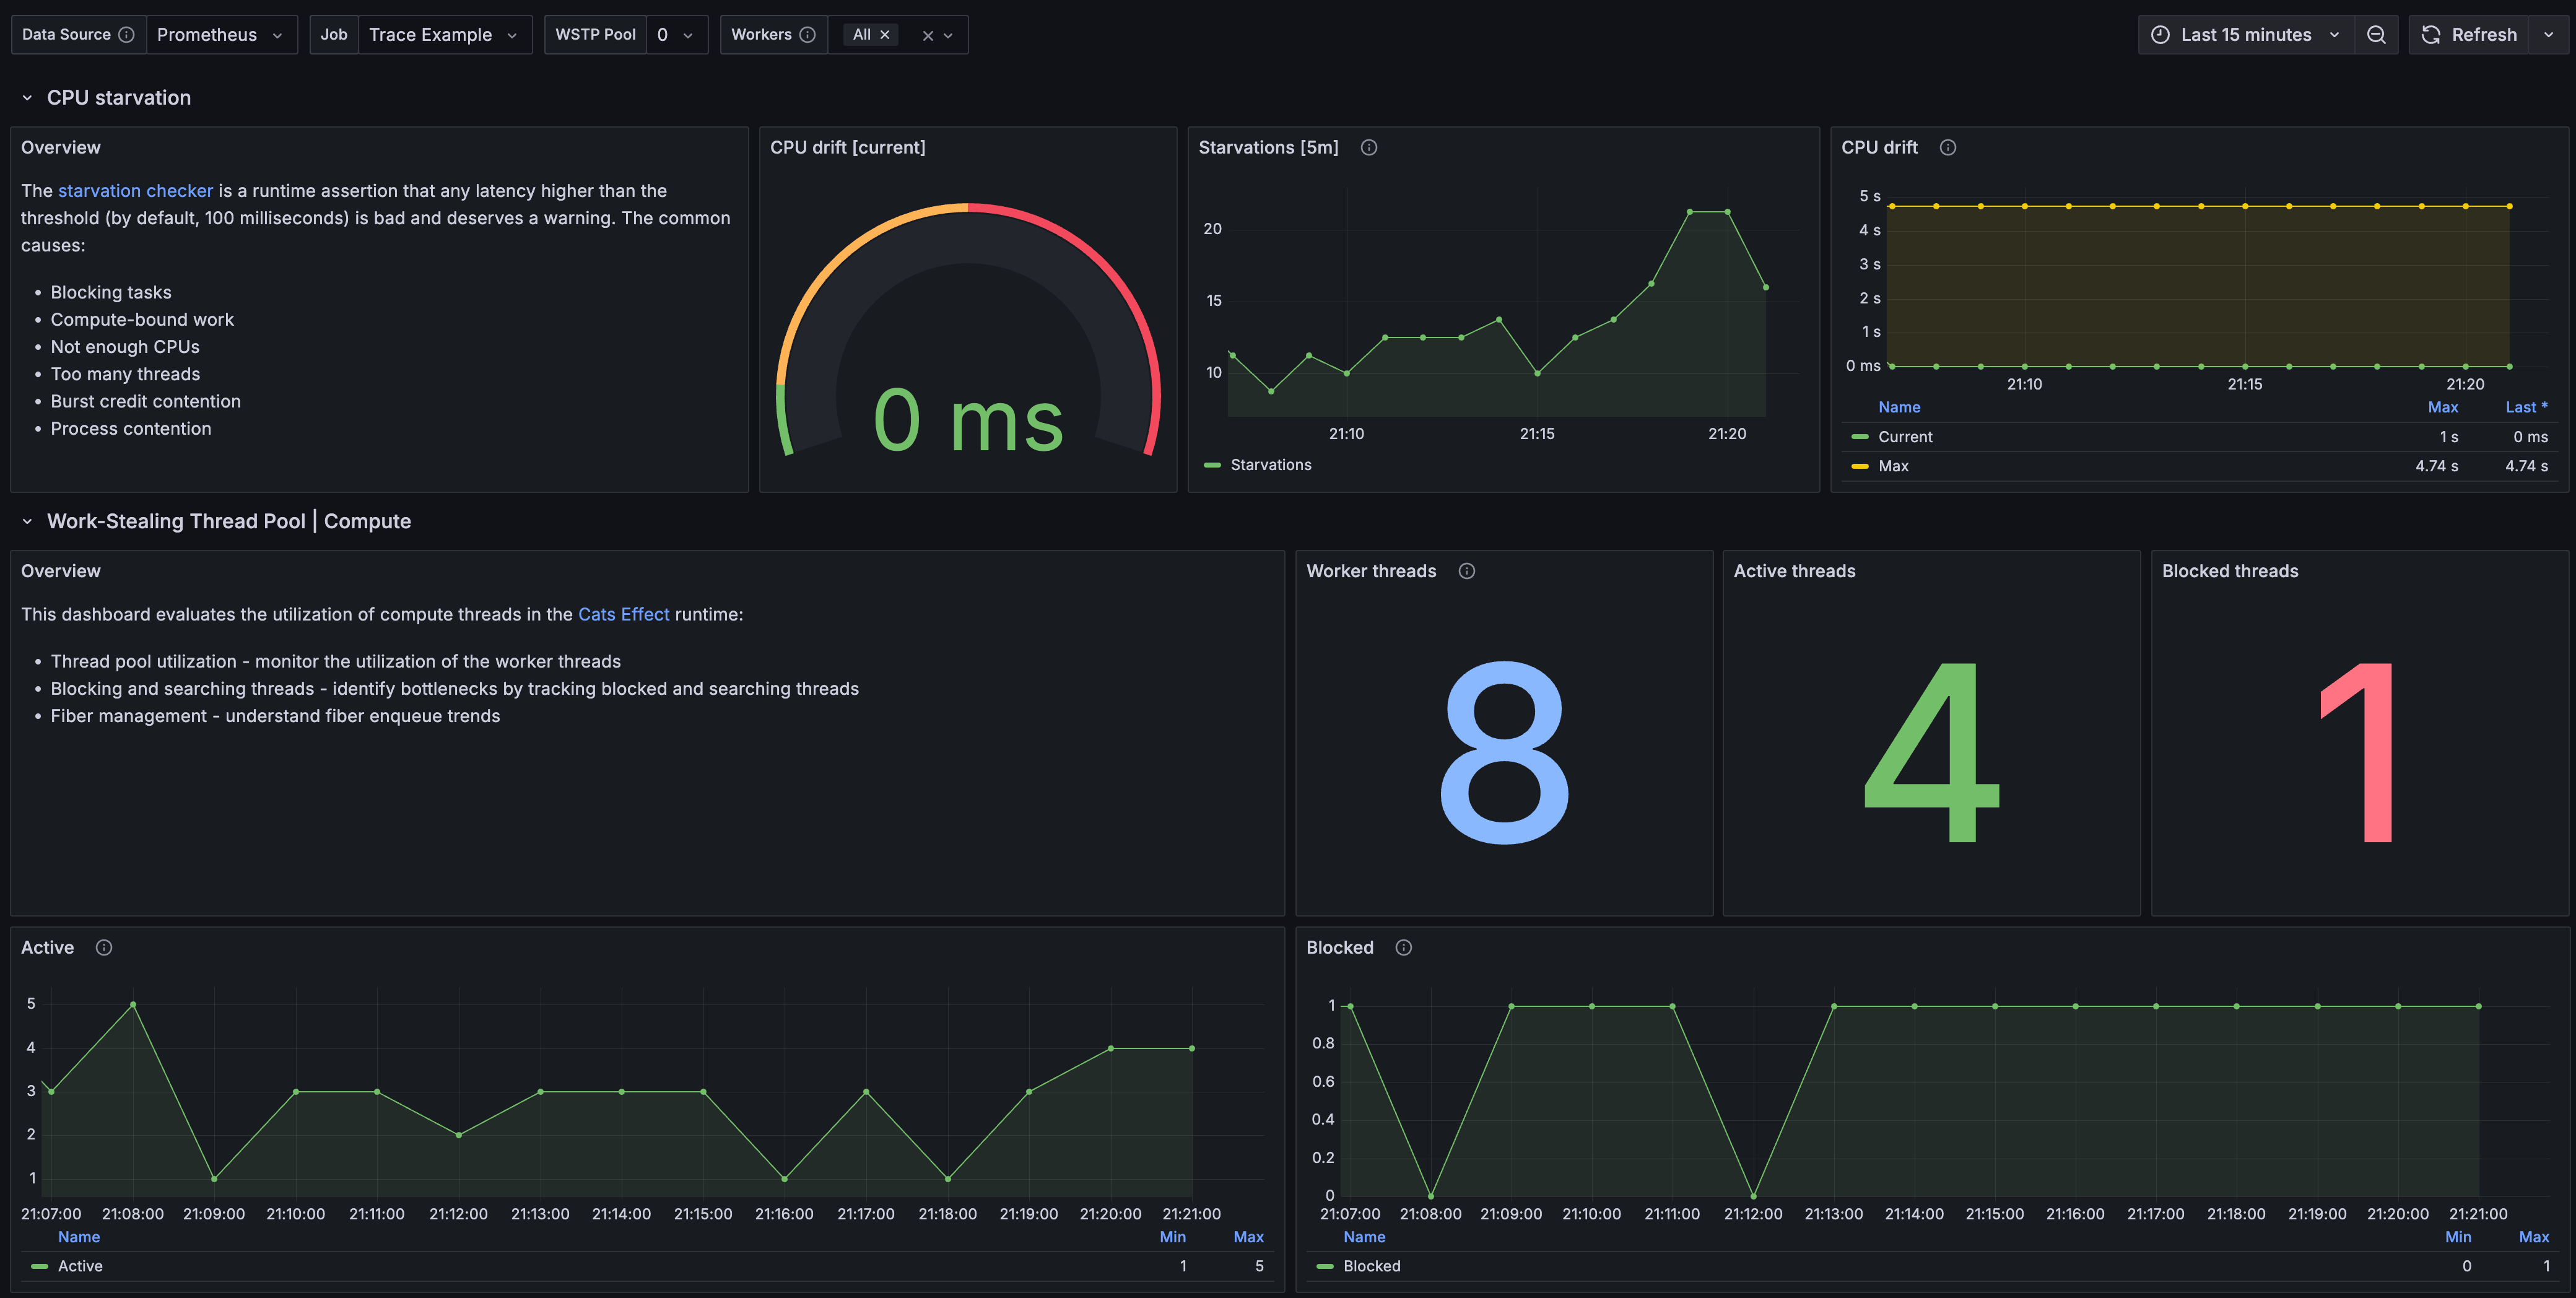
5. Import the Grafana dashboard
The dashboard requires a Prometheus data source containing the exported runtime metrics.
In Grafana, import the Cats Effect runtime metrics dashboard with ID 21487, then select that
Prometheus data source.
What's next
- Record application-specific metrics in your own code: Record application metrics
- Export JVM runtime metrics with OpenTelemetry Java: Register JVM runtime metrics